 |
|
4000
Reasons map
|
|
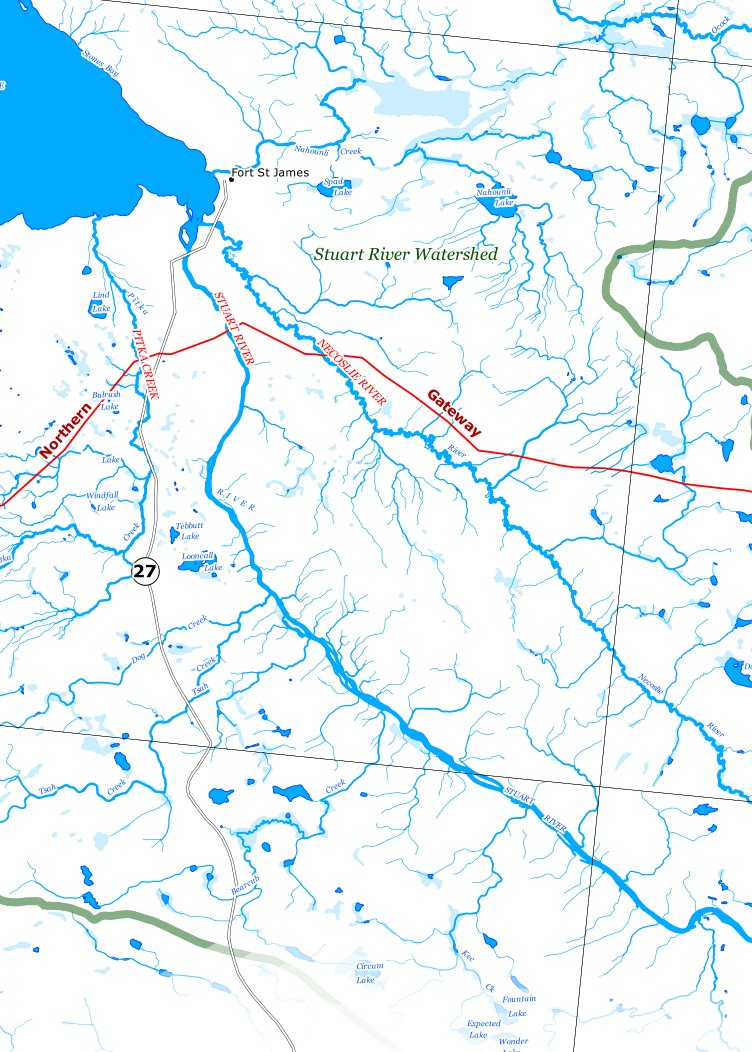
The 4000 Reasons Festival was held in Smithers on June 6th, 2012, to celebrate the 4000 people in British Columbia who signed up to speak to the panel reviewing Enbridge's application to build the Northern Gateway Pipeline. The Driftwood Foundation asked me to prepare this map for the festival, a map showing all the named and unnamed waterways in BC that the pipeline would cross. The full map (only a small detail is shown above) is 66.04cm (26") high and 424.1.80cm (167" or 13' 11") long. At 1:150,000, it is more detailed than the six or seven 1:250K topos it would take to cover the same area. (Download complete map image at 100dpi -- 5MB) The streams and rivers shown on this map come from a provincial data set called the 1:50,000 Watershed Atlas. It can be downloaded from BC's Land and Resource Data Warehouse (LRDW). To keep the map focussed, I restricted the waterways to those within 25km of the proposed pipeline - beyond which they fade away. In this dataset every piece of every stream has been assigned a "stream order" number from 0 to 6 that expresses how far downstream in the water network it is. Streams of order 0 are at the top of the watershed; they combine to form streams of order 1, which combine to form streams of order 2, and so on. I used the stream's order as a thickness multiplier for the basic blue line, so as we work our way downstream on this map, it gets thicker. Like the 1:50,000 topographic maps and the 1:20,000 TRIM maps, the Watershed Atlas does not know the names of most of the waterways in BC. Other data sets, such as the Corporate Water Base and the Freshwater Atlas are similarly spotty on naming. The route of the proposed pipeline is from a Google
Earth data file available at pipeupagainstenbridge.ca,
a file Major watersheds come from the "BC Major Watersheds" layer at LRDW. Towns and the provincial border are from the 1:2million data at BC's Ministry of Energy and Mines Geospatial Data Downloads. The map's projection is UTM Zone 12, a projection
usually reserved for areas farther east. However, in this case The map was composed entirely in QGIS, and exported from a print composer directly to PDF. The full map at 300dpi is 46MB, so I have not posted it. But if anyone would like a copy, please email me and I will post it for you. The Watershed Atlas has a text annotation layer, which includes each piece of waterbody-related text that would be displayed on a 1:50,000 map, its angle and its font size. Without this ability to label the waterways attractively and automatically (it required only a little tweaking) making a map this big woud have taken a great deal of time. |